Blog
A 3 MB compiler that turns a spec into AArch64 code in 5 ms, and where it still loses
[measured on a shared Railway lab; run times are qemu emulation, instruction counts are exact; t27b's code is -O0 class] t27b 0.2.0, released with the signed receipt of the very binary it ships, compiles a t27 spec with its tests in about 4.8 ms as a native x86_64 cross-compiler: 8.8x faster than gen-c plus gcc -O0 and about 640x faster than zig Debug per spec, in 5.3 MiB of memory, from one binary of about 3 MB, and it agrees with the reference on all 8,344 tests both ran. It is not a breakthrough in generated code: it executes 3.4x the instructions of gcc -O2 and 4.5x those of zig ReleaseFast, its code is up to 2x larger, and on Linux it is a JIT test runner that cannot yet write an ELF binary. Over the week its share of the reference's passing specs rose from 8.6% to 98.9%.
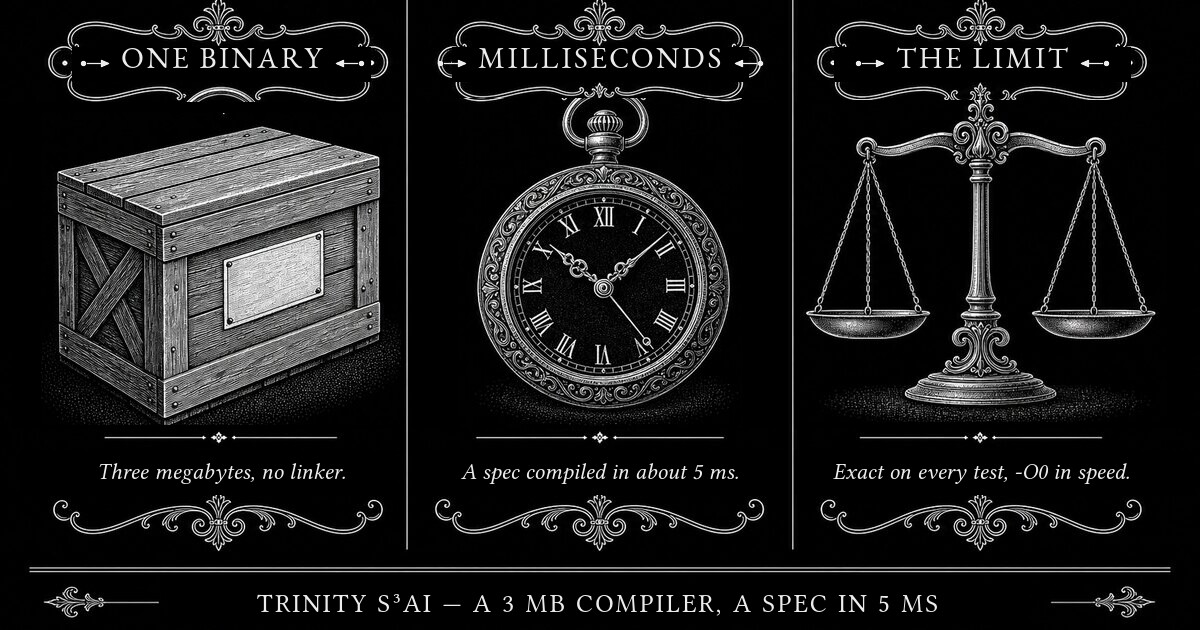
- ONE BINARYThree megabytes, no linker.
- MILLISECONDSA spec compiled in about 5 ms.
- THE LIMITExact on every test, -O0 in speed.
Here is a compiler you can download as one file of about 3 MB. Give it a .t27 spec and about 5 milliseconds later it has parsed and type-checked the spec, lowered it, and written AArch64 machine code for every function and every test in it. It needs no LLVM, no assembler and no linker, and while it works it uses about 5 MiB of memory. That is t27b, the native backend of the t27 language. On 10 October it shipped as version 0.2.0, together with a signed receipt for the exact binary in the release.
We also measured it against zig, gcc, clang and rustc, on the same specs and the same machine, and the honest result has two halves. t27b is very fast, very small, and it agrees with the reference on every test. The code it writes is slow: about as good as gcc -O0, and three to five times behind every optimising compiler. This post shows both halves, how they were measured, and how to check them yourself.
t27b 0.2.0 · check the binary, compile a spec
What t27b is
t27 is a spec-first language: a .t27 file holds types, functions, tests and invariants, and t27c turns it into Zig, C, Rust or Verilog. t27b is the other road. It reads the same file through the t27c front end it mounts, lowers it to its own IR, and emits AArch64 machine code directly. t27b test runs every test in an in-process JIT and checks each result against t27b's own IR interpreter; t27b build writes a Mach-O object. New lowering decisions live in .t27 plan specs that t27c gen-rust turns into Rust, under the project's rule that new logic is written in t27.
The result in one table
| Axis | t27b | The others | For t27b |
|---|---|---|---|
| Compile time per spec | 4.8 ms, native x86_64 cross-compiler, tests included | gen-c + gcc -O0 42 ms; gen + zig Debug 3.05 s; gen + zig ReleaseFast 13.8 s | wins: 8.8x, 640x, 2,900x |
| All 20 specs, zig in one invocation | 0.72 s | zig Debug 6.21 s; zig ReleaseFast 32.9 s | wins by less: 8.6x and 46x |
| Peak memory while compiling | 5.3 MiB (median over specs) | zig 354 to 500 MiB; gcc 27 to 32; clang 68 to 76; rustc 112 to 120 | wins |
| What has to be installed | one binary of about 3 MB | zig 363 MB; gcc for aarch64 about 145 MB; rustc 790 MB | wins, but it cannot link an executable |
| Agreement with the reference | 0 of 8,344 tests differ | zig ReleaseFast flips 7 files; gen-c + clang disagrees with itself on 39 | exact |
| Rebuilds | bit-identical, also from another directory | gcc (without -g) and rustc too; zig records the build directory | ties the best |
| Instructions its code executes | about gcc -O0 (0.91x) | 3.4x fewer with gcc -O2; 4.5x fewer with zig ReleaseFast | loses |
| Code size | 1.8x to 2.0x the optimising builds | gcc -O2, zig ReleaseSafe, zig ReleaseFast | loses |
| Coverage at the bench commit | 1,296 of 1,311 reference passes (98.9%) | zig built for aarch64: 1,311 | slightly behind |
Compile time: milliseconds against seconds
The lab is an x86_64 machine, so t27b was built for the host as well. On x86_64, t27b test runs the front end and the code generator, tests included, and stops only when it tries to map the JIT; the wall time of that process is t27b's compile time. Every other pipeline also ran natively, with the t27c generator's time included in its own. One process at a time, six rounds round-robin over specs and pipelines, warm medians reported.
Most of zig's time per spec is fixed cost: building the test runner, the parts of std that panic and format, and the link, all through LLVM. Small and large specs alike took 2.7 to 3.4 s in Debug. Build all 20 specs in one invocation and zig spends 0.31 s per spec: the gap falls from about 640x to 8.6x in Debug, and from about 2,900x to 46x in ReleaseFast. t27b has no multi-file mode, so its total is 20 separate processes. Over the 567 files every pipeline passes, t27b compiles 183 files a second; gen-c plus gcc -O0 manages 28.
One correction we owe: earlier reports quoted t27b compile times of 33 to 86 ms. Those were measured under qemu. Calibrated against the native build on the same specs, emulation made t27b's compile phases about 20x slower (geometric mean), so the native figure is an order of magnitude lower.
Memory and footprint
t27b's median is 5.3 MiB, and its hungriest spec needed 48 MiB. zig needs 354 MiB in Debug and 500 MiB in ReleaseFast, about 67 and 95 times more. The install tells the same story: one executable that links Rust's std statically and needs glibc at run time, against hundreds of megabytes of compiler, libc sources and LLVM. The price of that smallness is real: t27b cannot link an executable.
Exact against the reference
The reference is t27c gen followed by zig test in Debug, run natively. t27b ran the whole corpus, 1,819 files, through its JIT and its interpreter, and wherever both sides ran a file's tests they were compared test by test: 0 of 8,344 tests differ. zig Debug built for aarch64 and run under the same qemu also agrees with t27b on all 8,344.
The optimisers are less exact. zig ReleaseFast flips 7 files against zig Debug; one of them is a test that reads a stack slot after its frame has returned. The C road is worse. gen-c output contains undefined behaviour, so its verdict depends on the optimisation level: clang -O0 and -O2 disagree on 39 files and 107 tests. The smallest case is a function gen-c prints as bool dummy(void) { true; }, with no return. It passes under gcc -O0 and clang -O2, and aborts under gcc -O2 and clang -O0.
Every pipeline is deterministic in place. t27b, t27c's generators, gcc without -g and rustc are also bit-identical when built from another directory; zig and zig cc record the build directory in their debug information. The t27b lab's signed receipts depend on this property: two runs of one commit must produce one Merkle root.
Where t27b loses
This is the half of the result that does not make a headline. t27b's code executes about as many instructions as gcc -O0 and about half as many as zig Debug. Against every optimising build it is 3 to 5 times behind: 3.2x zig ReleaseSafe, the build with the same run-time checks; 3.4x gcc -O2; 4.5x zig ReleaseFast. Under qemu that is 3.4x to 4.1x the run time, and on the crypto specs the gap to zig ReleaseFast reaches 10x in instructions.
| Where | The number | What it means |
|---|---|---|
| Generated code | 3.4x the instructions of gcc -O2, 3.2x zig ReleaseSafe, 4.5x zig ReleaseFast | a program t27b builds runs slower than the same program from any optimiser |
| Code size | 1.8x to 2.0x every optimising build | more bytes for the same functions |
| Coverage | 1,296 of 1,311 at the bench commit (files with tests); 1,349 of 1,364 at the release (the lab tally) | i128 stage 3, @cos and two empty typed array literals still block |
| Linux executables | Mach-O objects only: no ELF, no link step | on aarch64-linux t27b runs tests in its JIT; it cannot ship a binary |
| Self-generation | 36% of the backend is generated from .t27; 12% counting the front end it mounts | most of the code t27b runs is still hand-written Rust |
| DDC | DDC_BACKEND_AGREEMENT, not DDC_INDEPENDENT | the three routes share one front end |
| Random programs | 7 disagreements per 1,000 programs (3 in the release run) | the fuzzer reaches code the corpus does not, and still finds differences |
| Per-test reset | t27core runs 8.3x slower than under zig Debug | jit.call copies all module state before every test |
| Amortisation | the 640x lead falls to 8.6x when zig builds 20 specs at once | t27b has no multi-file mode |
Two smaller costs. Overflow checks, on by default, cost about 12% of the instructions and 24% of the emulated time. And one spec, compiler/core/t27core, runs 8.3x slower than under zig Debug although t27b executes fewer instructions: before every test jit.call copies all module state so that each test starts fresh, and each of t27core's 95 tests pays at least 2.8 ms for that copy.
How it was measured, and what to distrust
- One shared machine. The Railway t27c lab: an Intel Xeon 6975P-C host with 48 threads and a 24-CPU quota, shared with other agents' jobs. The host load was recorded with every sample (27 to 103). Medians are reported because the spread is real: for compiles of a few milliseconds it reached 34% for t27b and 36% for gcc -O0.
- Run times are emulation. Everything ran under qemu-aarch64 7.2 on x86_64. That ranks pipelines on this host; it is not arm64 speed, and its cost depends on the instruction mix (on kernel_sieve, zig ReleaseFast executes 43% fewer instructions than t27b and still takes 25% longer). The instruction counts are the better measure.
- The spec set was chosen without looking at t27b: the 20 files with the most gcc -O0 instructions among the 567 every pipeline passes. That rule leaves out everything gen-c cannot compile, so the crypto specs were measured against zig only.
- Different run-time contracts. t27b resets module variables before each test and runs invariants at run time; the zig and C runners keep state, and fold or drop invariants. Run-time sums use only the tests every pipeline ran.
- Cold means the first run of a pass, not an empty page cache. zig's truly cold first build, with an empty global cache, was measured on its own: 6.2 s in Debug, 17.2 s in ReleaseFast.
- Four instrument bugs were caught during the run and fixed before these numbers: a zig symbol filter that read 0 bytes, rustc's per-function sections, test names with spaces, and an 11.5 MiB floor in memory readings taken from Python. Each was noticed because a number was implausible.
- The harness is not committed. It is about 1,650 lines of lab-scratch Python, Zig and C, kept out of the repository under the project's only-t27 rule; every command it ran is written out in the report, so the numbers can be reproduced.
A week of coverage
On 4 October t27b passed 56 of the 648 specs the reference passed. v0.1.0, on 8 October, passed 899 of 1,099 with runtime checks and 150 more vacuously. v0.2.0 passes 1,349 of 1,364, with 5 vacuous, and 0 of its 8,629 compared tests differ from the reference. Between the benchmark commit and the release four more blockers fell, and t27b's passes rose from 1,312 to 1,349 while the reference's rose from 1,331 to 1,364: anytype monomorphization (t27#8738), run-time i128 stages 1 and 2 (t27#8750, t27#8795), and frames up to 16 MiB of local aggregates (t27#8764).
What is left on the ledger: run-time i128 stage 3 for tri/t27b/eval_arith.t27, @cos (t27#8677), two empty typed array literals, five stubs that pass with nothing to assert (t27#8766), and five rows where the reference passes for the wrong reason and t27b is right to refuse.
Why you can check this
The binary in the release is not a rebuild. It is the file the t27b lab ran the whole corpus with, and its sha256, 0202a2ae..., is the t27b_sha256 field of the lab's receipt for that run. The receipt is signed with Ed25519 under the domain line t27-corpus-receipt-v1, and it carries Merkle roots over every input file, every verdict and every generated listing. From a t27 checkout, t27c corpus-receipt compare R R checks the signature and rehashes every leaf:
base "59e2c87c4bd74c1137f4071b5e63095a285ce5e4" AUTH_MISSING_NONE AUTHOR leaves-bound true
head "59e2c87c4bd74c1137f4071b5e63095a285ce5e4" AUTH_MISSING_NONE AUTHOR leaves-bound true
totals true inputs true verdicts true outputs true: EQUIVALENT
Every corpus run also executes each test twice, in the JIT and in t27b's own IR interpreter, with 0 mismatches. And a signed DDC receipt builds t27core's self-compile three ways, through gen-c and cc, through t27b and through zig, and all three stage-2 digests agree.
Now the limits, because they are the point of the exercise. That DDC verdict is DDC_BACKEND_AGREEMENT, not DDC_INDEPENDENT: all three routes share t27c's front end. The JIT and the interpreter read the same IR. The reference t27b agrees with on 8,344 tests comes out of the same front end that t27b mounts. The random-program fuzzer is the one check that reaches beyond the corpus, and it still finds disagreements: 7 per 1,000 programs in the run the report cites, 3 in the release run. No check here compares t27b with an independently written t27 front end. The verification is unusually visible; most of it is still self-consistency.
What comes next
- An optimiser, or not? The data says t27b is a baseline compiler, the role that copy-and-patch JITs and Cranelift play as a fast first tier. A register allocator and a few peephole passes would close part of the 3 to 5x gap and spend some of the 5 ms; whether that trade is worth making is open. No copy-and-patch JIT and no Cranelift was measured here.
- ELF output and a link step, so that t27b can ship a Linux binary instead of only running tests in its JIT.
- Run-time i128 stage 3 and
@cos, the last unimplemented blockers on the ledger. - The port. Today 36% of t27b's backend and 12% of the code it runs are generated from
.t27; the owner's rule is that no change may grow the hand-written Rust incli/t27b. - The fuzzer's disagreements, and a cheaper per-test reset for specs with large module state.
Verdict
Not a breakthrough in generated code. A fast, lean baseline compiler that is exact against its reference: a 3 MB, LLVM-free compiler that needs about 5 MiB of memory, turns a spec into AArch64 code in about 5 ms, and agrees with the reference on every one of 8,344 tests. That is the axis to lead with, and the 3 to 5x gap in code quality is the axis to work on. The release, the benchmark report with every caveat (t27#8855), the improvement loop (epic t27#8326) and the receipt of the release run are linked below.
What this does not settle
- No native arm64 per-spec timings exist yet: every run time here is qemu emulation on x86_64, which ranks pipelines but is not arm64 speed.
- Would an optimiser keep the compile time in milliseconds? Nothing here measures a t27b with register allocation, and no copy-and-patch JIT or Cranelift was measured either.
- The fuzzer's disagreements (7 per 1,000 programs in the report's run, 3 in the release run) are not triaged in this post.
- Every check agrees with a reference that shares t27b's front end; no independently written t27 front end exists to compare against.
- t27b cannot link or write ELF, so it cannot ship a Linux binary; the comparison is between a JIT test runner and compilers that produce executables.
Receipts
- The release: t27b v0.2.0, with the binary, its signed receipt and the run JSON
- t27#8855: the benchmark report, t27b against zig, gcc, clang and rustc, with every caveat
- t27#8817: the benchmark issue
- t27#8326: epic, the t27b improvement loop
- The signed receipt of the release run, t27 59e2c87c4
- Every t27b lab run: the source of the coverage figure
- The recording: check the release binary, compile a spec
- t27#6063: epic, t27b coverage
- t27#6198: the port of t27b into .t27
- t27#8738: anytype monomorphization · MERGED 2026-10-10
- t27#8750: run-time i128, stage 1 · MERGED 2026-10-10
- t27#8795: run-time i128, stage 2 · MERGED 2026-10-10
- t27#8764: frames up to 16 MiB of local aggregates · MERGED 2026-10-10
- t27#8677: @cos, still open
- t27#8766: the five vacuous stubs, still open
- The first release, t27b v0.1.0 (t27#7701)
- The first t27b post: where t27c's compile time goes, and a backend without LLVM
Work with me
Want this kind of check on your own design?
I audit RTL and build independent, bit-exact models, then take the result through synthesis and, when useful, onto an Artix-7 board. The first conformance module is free.